As a programming hobbyist, I am thinking about the idea of extending QCAD’s facility to import ascii points. The most practical approach would be to further develop the existing facility but I need to know how the relevant source code can be accessed and where it resides in the binaries. Can anyone help me with that?
You can find the example scripts under “scripts” in your QCAD installation or in our git repository:
hi,
Points from a CSV file … kinda ASCII with a certain format … can be imported with DrawFromCSV.
The tools allows importing most basic shapes from a CSV file. Usually sourced from a spreadsheet.
Also, one could simply use the multi line capabilities of the command line. 
Copy the point data, start the point tool (PO) and paste the list in the command line.
The list should then be formatted according your QCAD native settings.
Menu .. App.Prefs .. General .. Coordinate Format (Ctrl.+,)
- x.xxx,y.yyy (Comma/Dot)
x.xxx;y.yyy (Semicolon/Dot)
x,xxx;y,yyy (Semicolon/Comma)
Regards,
CVH
Thank you for your response. My intention is not only to plot points but also labels for the point name, elevation and code. Librecad has an excellent facility for that and my idea is to replicate that.
Hi,
If look that up then I come to: LibreCAD-user - ASCII file format
N,X,Y,Z,C
Well, I didn’t include the Z value throughout the DrawFromCSV tool for the obvious reason that QCAD is 2D.
What are you going to use for N and C?
DFC supports Layers, text and custom properties.
Regards,
CVH
Rather similar post:
CVH
Land surveyors use CAD to plot topographic maps from ASCII coordinate files that typically list points in the format N,X,Y,Z,C for example: 1,100,25,50,CLR. Here 1 is the point name (N), 50 is the elevation (Z) and C is a description (e.g. CLR = Centreline of Road). The Z value is not plotted as a coordinate but as a label (same as N and C) which gives the spot height of the point. All of this information is contained in an ASCII file supplied by the surveyor.
The requirement is that N, Z and C must all be plotted adjacent to their point location. Is QCAD able to do that?
John: thanks for the details. Sounds straightforward. Do you have a screenshot how this should be rendered? This would be a simple script that imports the CSV and plots the data accordingly.
Sure, with clever programming, all can be achieved.
The point was that before none provided a certain general format with requirements.
The code of ‘tomek’ should work out: import coordinates including point number, height and code
Regards,
CVH
The rendering is per tomek’s original post. As mentioned, my intention is to replicate the facility provided by Librecad which is coded in QML/C++. I also see from the documentation that it is possible to extend QCAD by means of C++ extensions. Perhaps that will be better than using JavaScript but I will need a sample of the C++ format. To get a better idea of my intention, may I suggest you take a look at the Librecad facility in the top menu >> Plugins >> Read ascii points.
And that is imported as such with the script lower in the topic.
Most/All tools are implemented in EMCAScript: GitHub - qcad/qcad: QCAD - The Open Source 2D CAD. QCAD is a cross-platform CAD solution for Windows, macOS and Linux. It supports the DXF format and optionally the DWG format (through a proprietary plugin).
Can’t keep you from doing it over in C++
Regards,
CVH
Because the Librecad plugin is coded in C++ it makes sense to stay with that if possible. The next step is locating a sample QCAD addon coded in C++ that nserts a menu item and links to the main program with a method to add points/text to the drawing (all in C++ instead of JavaScript). Do you know where I can find that?
This has come up a few times. We will likely add a more universal import of points / labels from CSV for the next release.
The existing “Draw from CSV” doesn’t work for me.
With entries as follows I get the message : Unsupported entry. Text line x.
12.5,5.4
7.3,2.5
23.5,5.6
I’d include a screen shot if there was a convenient way of doing that.
DrawFromCSV is set up different.
It can draw most basic shapes from a csv usually sourced from a spreadsheet.
Documentation can be found in the pdf: UPDATED 3.04: Import and draw entities from a CSV file
Example files are included.
A list like:
12.5,5.4
7.3,2.5
23.5,5.6
can be imported by Menu .. Misc .. Import/Export .. Import points.
Or simply by starting the point command and pasting the list in the command line.
If you install the code by ‘tomek’ as ImportPoints.js under …\QCAD\scripts\Misc\MiscIO\ImportPoints
Then the standard ImportPoints script is superseded by import survey points.
Regards,
CVH
I have tried tomek’s solution and the result is a mess with the labels being unreadable blobs all
positioned on top of each other. In any event, this project is becoming tedious and I will find something else to do.
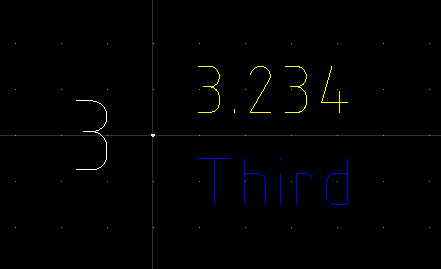
One needs to individually move each layer and change its text size. If you are happy with that, let’s leave it there but how would any surveyor know about tomek’s method? Without that knowledge, QCAD would appear inadequate to his needs.
Incidentally, is it possible to retain the old Import Points function after including tomek’s script?
I’ve got both the old and new scripts in the menu and running separately now. Surveyors also use a third system: N, X, Y, C for cadastral points and setting-out.
The case is that an XY, NXYZC or NXYC list has no info on font and fontsize, layer names, colors, and so on.
The spacing in the text placement was simply solved with 3 additions and 2 subtractions.
        setCurrentLayer ("number");
        addSimpleText(coordinates[0], new RVector(parseFloat(coordinates[1]-0.1), parseFloat(coordinates[2])), 0.15, 0, "Standard", RS.VAlignMiddle, RS.HAlignRight, false, false);
        setCurrentLayer ("height");
        addSimpleText(coordinates[3], new RVector(parseFloat(coordinates[1]+0.1), parseFloat(coordinates[2])+0.05), 0.10, 0, "Standard", RS.VAlignBase, RS.HAlignLeft, false, false);
        setCurrentLayer ("code");
        addSimpleText(coordinates[4], new RVector(parseFloat(coordinates[1]+0.1), parseFloat(coordinates[2])-0.05), 0.10, 0, "Standard", RS.VAlignTop, RS.HAlignLeft, false, false);
        setCurrentLayer ("point"); operation.addObject(point);
Regards,
CVH